

Filters
Optolong L2 Dual Combo Filters Review
Thursday, July 30, 2026

Optolong's multi-narrowband (MNB) filter is called the L-Synergy. It has a 7nm wide pass band at O-III and another at S-II. When paired with their existing L-eXtreme filter and a one-shot colour (OSC) camera, one is able to produce nebula images using the Sulphur-Hydrogen-Oxygen (SHO) “Hubble” palette. The new L-Synergy filter is available separately, or paired with the L-eXtreme into what Optolong is marketing as their L2 Dual Combo. In this review I put the L-Synergy to the test, and explore the process of creating SHO images with an OSC camera. I also test the next generation of the L-eXtreme filter, which has received some upgrades from Optolong.
Objective:
In this review I compare the filters listed below (quoted price in USD for 2” version):
- Optolong L-eXtreme 1st Generation (s/n 13902204610) – $309
- Optolong L-eXtreme 2nd Generation (s/n 13902250402) – $329
- Optolong L-Synergy – $329 (L2 Dual Combo available for $539)
My samples of the L-eXtreme 2nd Gen. and L-Synergy were provided courtesy of Optolong. The 1st Gen. L-eXtreme I purchased back in 2020 when that filter first came out. Filter performance was evaluated based on the increase in contrast between the observed object and the background, which is a measurable quantity. It was evaluated quantitatively using the measured filter spectra combined with the spectra of several common deepsky objects, and by direct measurement from images captured using each filter and a OSC camera. The spectrometer data was also used to evaluate the signal-to-noise ratio (SNR) achievable using each filter.
Results – Spectrum Measurements:
The transmission spectrum for each filter, as measured on my bench spectrometer, is shown in Figure 1. The first observation to note is that the 2nd Gen. L-eXtreme has a much flatter top to its pass band response curves than its predecessor. This suggests that Optolong has refined its coating design, improving filter transmission and strengthening off band blocking. This observation is further supported by noting that the Hα pass band is better positioned and has a higher peak transmission than the 1st Gen. filter. The measured spectrum for the L-Synergy filter is as expected, and compares well with what is described in the Optolong marketing materials.
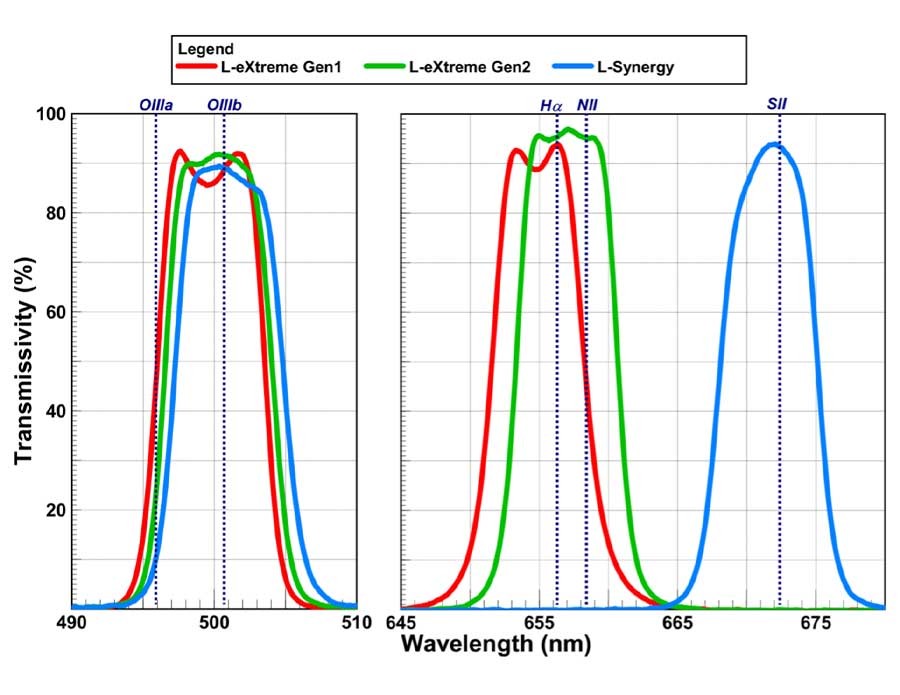
Figure 1 Measured Filter Spectra (f/∞)
My spectrometer testing included measurements over a range of filter angles to characterise the effect of operating on different speed optics. The resulting transmission rate of O-III and Hα versus optics f-ratio is plotted in Figure 2. Included on the figure is a summary table listing the full width half maximum (FWHM) band width calculated from my spectrum data, as well as a value of percent luminous transmissivity (%LT), a measure of generally how much light is getting through the filter. Note that for the L-Synergy filter it is the transmission of S-II that is plotted instead of Hα.
The f-ratio sensitivity of the new L2 Dual Combo filters is quite good, maintaining 90% transmission down to f/3. In fact, if one sets the cut-off for filter usefulness at 80% transmission, both of these new filters are usable down to at least f/2.3. That is significantly better than my sample of the 1st Gen. L-eXtreme which hits 80% transmission of Hα at f/4. This big reduction in f-ratio sensitivity is another clue that Optolong has made improvements to their coatings design, and has me wondering now if these new filters have solved the star halo problem as well.
The last piece of useful information to extract from the measured filter spectra is a prediction of the theoretical relative performance of each filter when imaging different
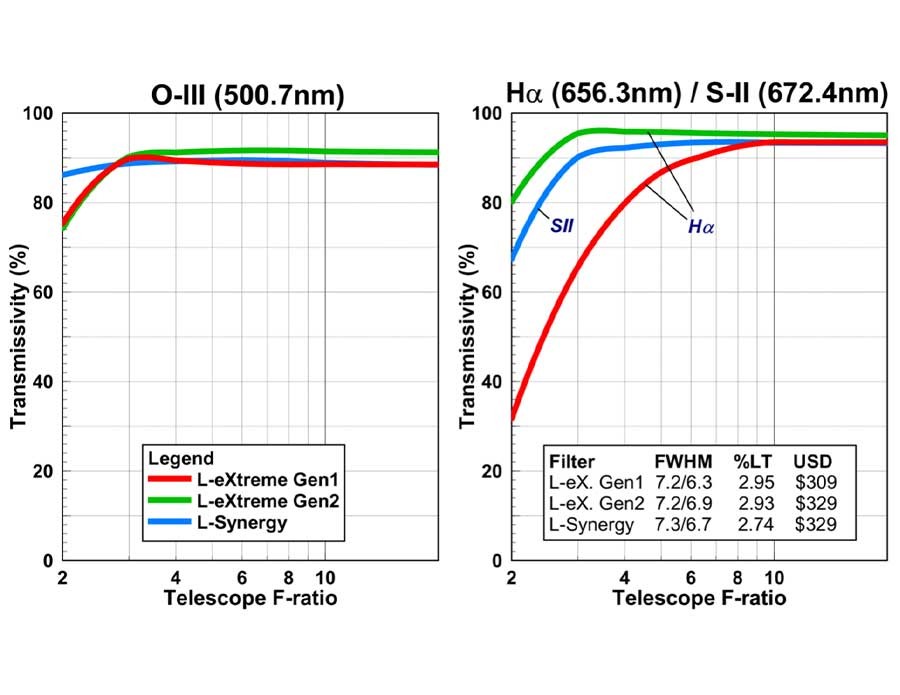
Figure 2 Measured Transmission vs. Optics F-ratio
types of objects. To do this I used the numerical method I developed back in 2012 which applies the spectral response of the filter and sensor combined with the spectral emission from the object and background light polluted sky to estimate the apparent luminance observed. Using this technique, I can predict both contrast increase and SNR relative to no filter, for a range of light pollution (LP) levels, which are expressed here in terms of naked eye limiting magnitude (NELM). The results of this prediction for the filters under test are provided in Figure 3. Performance for a range of classic man-made LP levels are shown as well as three special cases: urban LP with LED streetlights (NELM +2.9), dark sky with a full Moon (NELM +2.3), and urban LP with a full Moon (NELM +2.0). 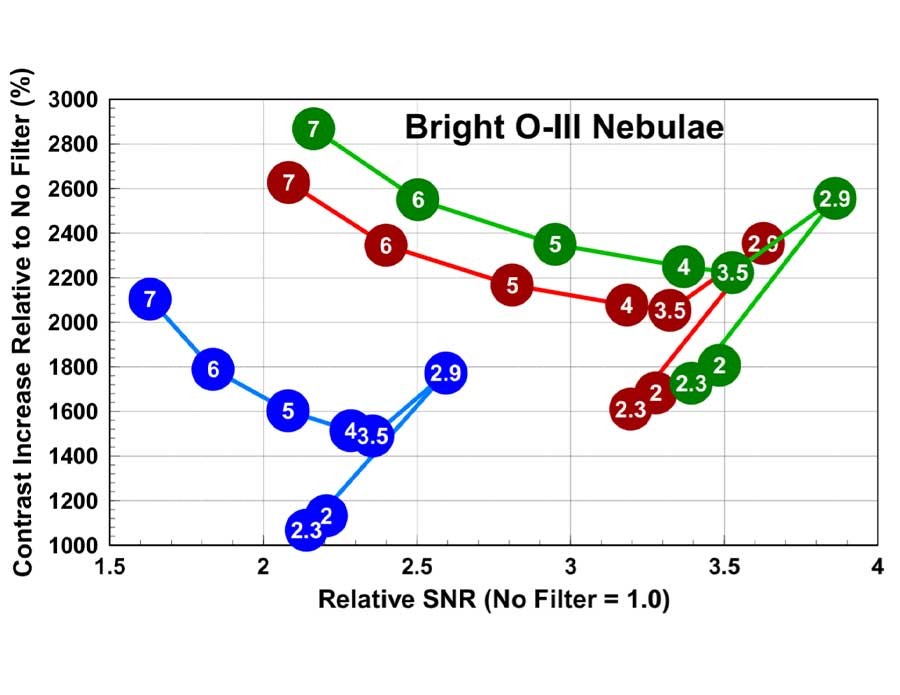
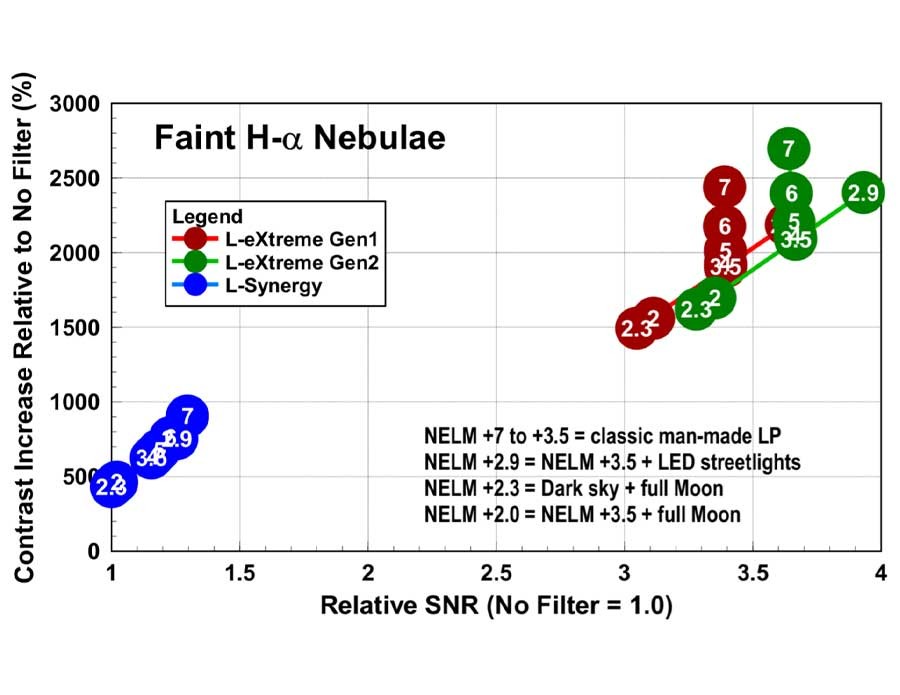
Figure 3 Predicted Filter Performance
Note that the prediction of SNR assumes a fixed exposure time combined with a perfect sensor, i.e. there is no read noise or dark current noise, only shot noise. In the figures, a filter has better performance the higher up and more to the right it is on each plot. Finally, a Sony back-illuminated CMOS sensor with STARVIS (Gen 1) technology has been assumed for all of these predictions.
Based on my predictions, the improvements made to the 2nd Gen. L-eXtreme filter result in it having better contrast increase and SNR than the 1st Gen. version. The L-Synergy filter is predicted to provide much less contrast and SNR than the L-eXtreme. This is because most emission nebulae, including the two used for my prediction target emission spectra (M27 & NGC7000), emit mostly Hα light. The L-Synergy blocks Hα, and as a result the filter takes a hit to its performance on nebulae. This is okay however since its main purpose of the L-Synergy filter is to allow the user to image S-II light, not Hα.
Results - Imaging:
Images of five different nebulae have been collected using each of the filters under test, including: NGC7000 “North American”, IC1396 “Elephant’s Trunk”, NGC6960/74/79/92/95 “Veil”, NGC6960 “Western Veil”, and IC1805 “Heart”. These images were captured on two consecutive evenings in late September 2025, with all image collection on a particular target completed within a 45-minute window. All images were captured from my Bortle 9+ backyard (NELM +2.9), and are live stacks produced in Sharpcap with an ASI533MC-Pro camera and a variety of telescopes including: a William Optics FLT98 @ f/6.3, and an Askar FMA180 @ f/4.5. The sub-exposure time (60s) and total exposure (10min) was held constant for all image captures with the exception of the reference images captured with no filter which required a much shorter sub-exposure (10s) due to my backyard LP level.
Images from the five objects are shown in Figures 4 to 8. As predicted, the 2nd Gen. L-eXtreme produced a better image than the 1st Gen. filter, with faint Hα emissions noticeably more visible and a stronger overall Hα signal in the images. The L-Synergy images provided an interesting alternative view of these commonly imaged objects. It is very evident however that the strength of O-III and S-II emissions varies widely from one nebula to another. Note the differences between the North American and Veil nebula images which have relatively strong O-III and S-II emissions, and those of the Elephant’s Trunk and Heart nebulae for which the O-III and S-II emissions are barely visible after 10 minutes of exposure. The strength of O-III and S-II emissions has implications for the generation of SHO images, as will be discussed later in this report.
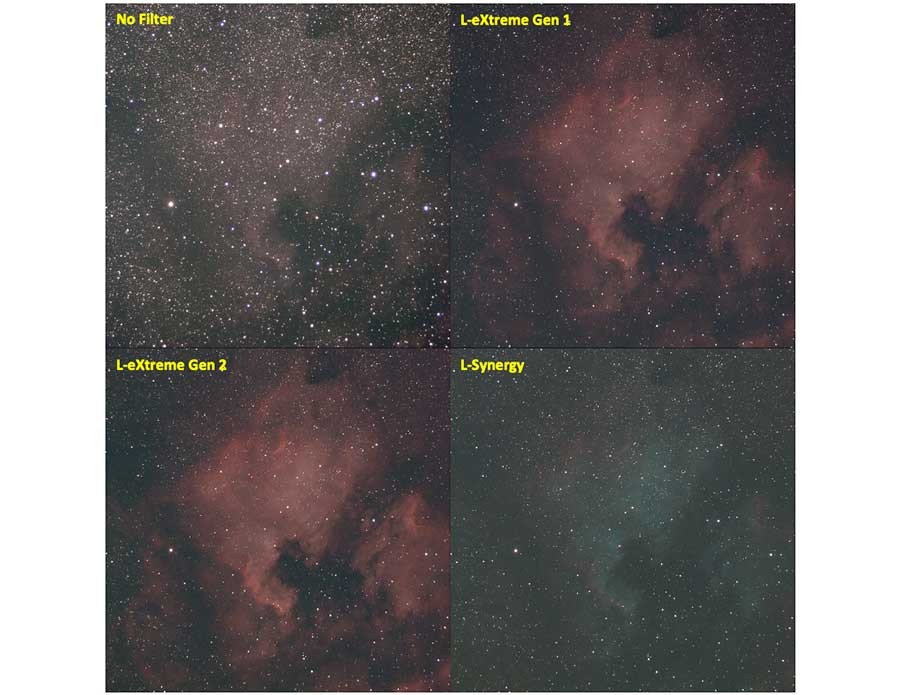
Figure 4 Sep. 19th Imaging Results – NGC7000 “North American”
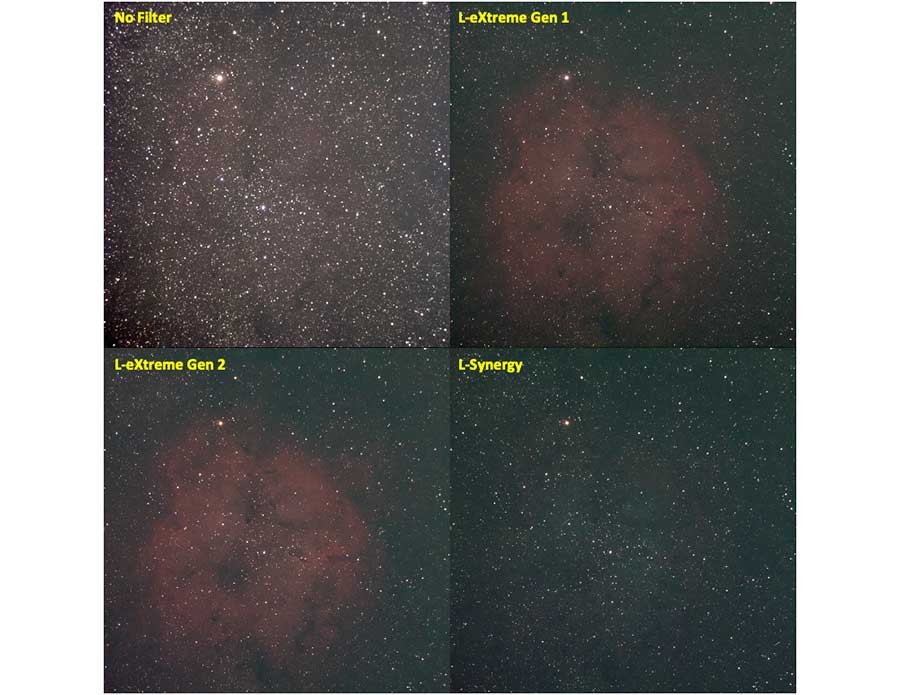
Figure 5 Sep. 19th Imaging Results – IC1396 “Elephant’s Trunk”
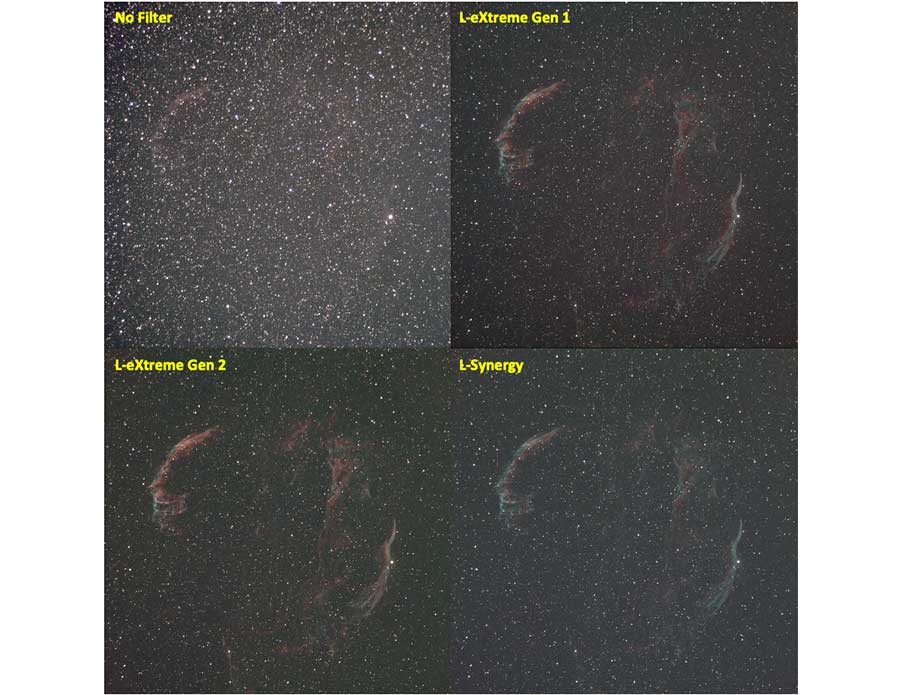
Figure 6 Sep. 19th Imaging Results – NGC6960/74/79/92/95 “Veil”
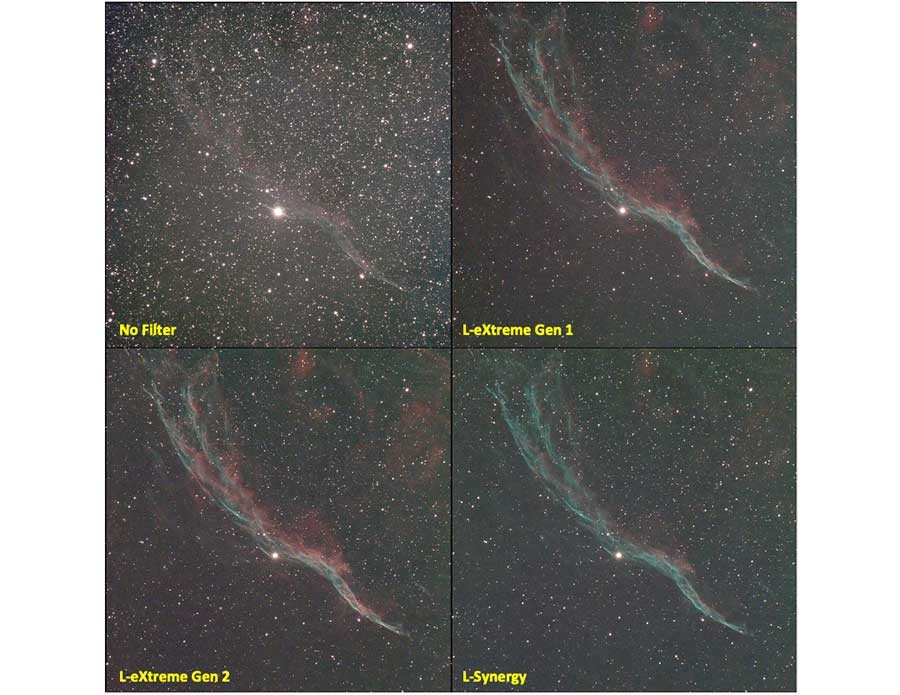
Figure 7 Sep. 20th Imaging Results – NGC6960 “Western Veil”
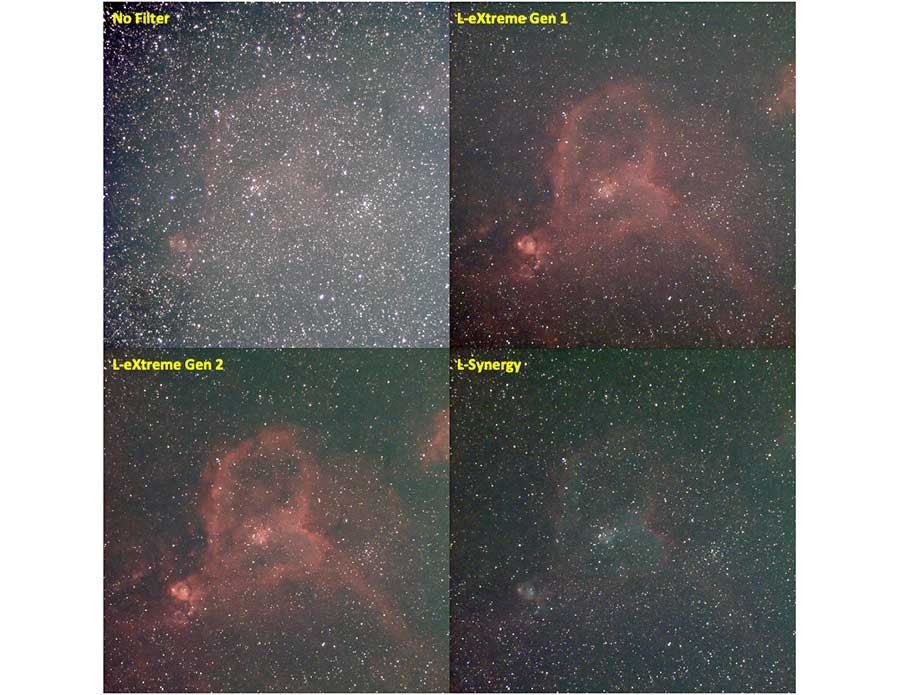
Figure 8 Sep. 20th Imaging Results – IC1805 “Heart”
Differences in filter performance are more apparent after using the raw captured image data to directly measure the contrast increase delivered by each filter. This was accomplished by using AstroImageJ to measure the average luminance from common areas in the images: a dark background area, and a bright nebulous area. The resulting contrast increase measurements are plotted in Figure 9. Note that the letter inside each data marker denotes the deep-sky target that particular point corresponds to.
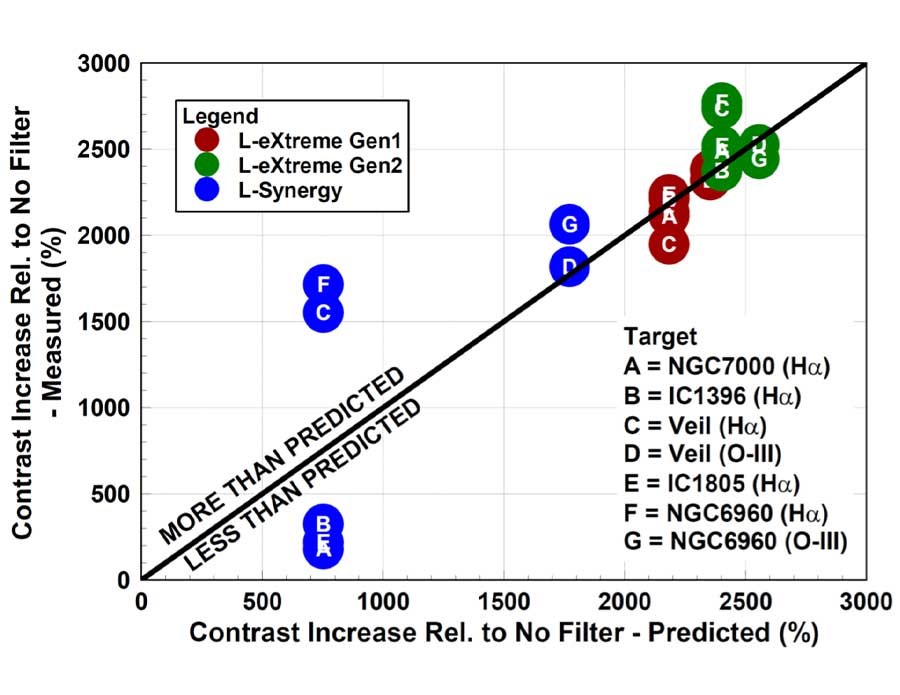
Figure 9 Measured Deepsky Object Contrast Increase vs. Predicted
The object contrast measured from the collected images aligns well on average with predictions. The improvement in performance of the 2nd Gen. L-eXtreme over the 1st Gen. filter is confirmed by these measurements. There was a lot of scatter observed in the measured contrast from faint Hα emission areas using the L-Synergy filter, a direct result of the large variation in S-II emission from each of my target objects in these areas.
The final observation to make from the image data is to compare each filter’s propensity for halos around bright stars. A blow-up of the area around Vega, captured on Sep. 19th, is shown in Figure 10. The 1st Gen. L-eXtreme produced an easily visible halo, but the two new filters showed no halos, a finding consistent with all the other improvements observed.
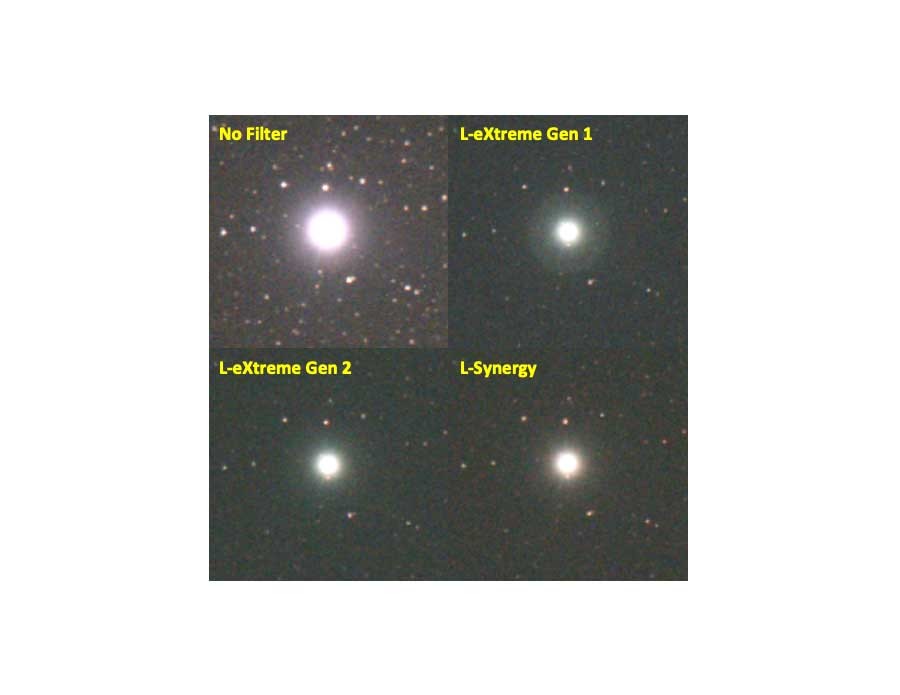
Figure 10 Examples of Halos Around Bright Stars – Vega (α Lyrae, +0.0, 9,000K)
Creating SHO Images:
I authored a magazine article back in May 2024 (“SHO On-the-Cheap”) about the process of using MNB filter pairs with an OSC camera in order to generate Hubble palette images of nebulae. The idea has been around since 2020 when IDAS released their NB-2/NB-3 MNB filter pair. Since then a number of filter manufacturers have come out with their own filter pairs, including the recent offering from Optolong that I discuss in this report. Table 2 summarizes the MNB filter pairs available today along with some basic filter properties. It is interesting to note the large increase in the price of these filter pairs since my 2024 article, a result of the import tariffs the United States has placed on Chinese-made consumer products.
One important finding reported in my 2024 article, and observed in the images collected for this report, is the fact that many emission nebulae are weak emitters of O-III and S-II, with S-II being by far the weakest of these two emissions. This means that the imager should be prepared to use significantly more time to collect their O-III and S-II data then they are used to for their Hα data. A secondary issue related to the disparity between nebula emission band strengths is the challenges associated with picking a suitable sub-exposure. When collecting your S-II image data, it may not be possible to select a sub-exposure time that is optimized to give the best dynamic range for your camera-telescope setup without over exposing the O-III data. This is one of several drawbacks of using a OSC camera to generate SHO images.
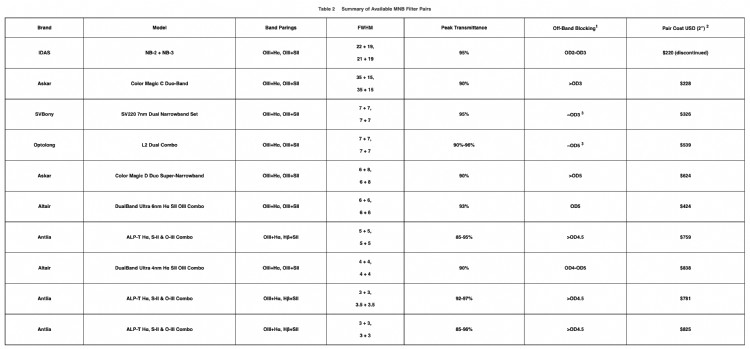
Off-band blocking has a direct influence on halos around bright stars. Based on my testing OD5 or better is required to have no halos. OD3 results in easily visible halos.
- Not including shipping costs.
- OD value not provided by manufacturer, estimated based on my test results.
For this report, I have attempted to assemble SHO images for all five of the objects imaged. In many cases the O-III and S-II image data had to be stretched aggressively in order for it to be visible against the strong Hα emissions. I don’t pretend to be an astrophotographer, so I am sure somebody with real image processing experience would be able to get a better end result. Nonetheless, the results of my pedestrian photo editing efforts are presented in Figure 11 to 15. Note that magenta halos around stars is a side-effect of having to aggressively stretch the O-III and S-II image data (i.e. red & blue channels in the SHO image, red + blue = magenta). This can be avoided by using software tools to remove the stars from the image and post process them separately from the nebulosity, adding them back into the image at the end.
Conclusions about Optolong L2 Dual Combo
Based on the results of the testing described above, I have found the new Optolong L2 Dual Combo to perform well at the task of collecting good quality image data for producing SHO images with an OSC camera. These 2nd Gen. Optolong filters have increased transmittance, reduced f-ratio sensitivity, and no halos around bright stars.
The process of creating an SHO image from two OSC colour images is not difficult, it just requires additional time to post process the image data. From the sampling of nebulae I have attempted to collect S-II data on, it appears that in general the S-II signal is weak. Significantly more exposure time is necessary to capture good quality S-II data than one would be used to for Hα data.
